Commitment
Gross government debt
Is the Commonwealth's debt going up or down?
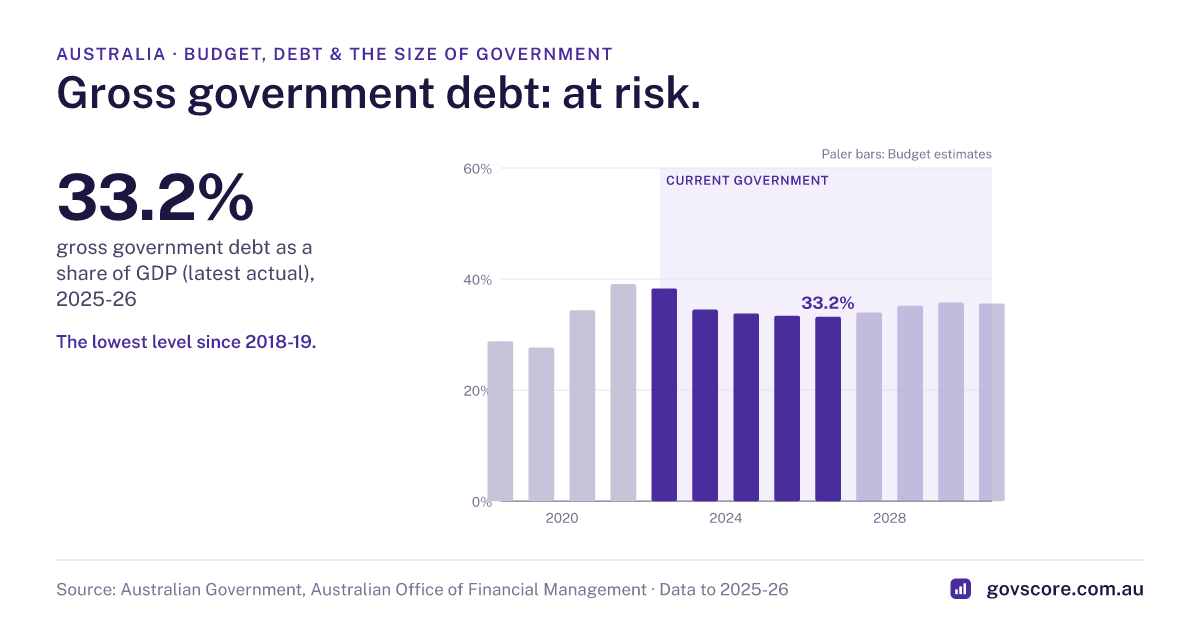
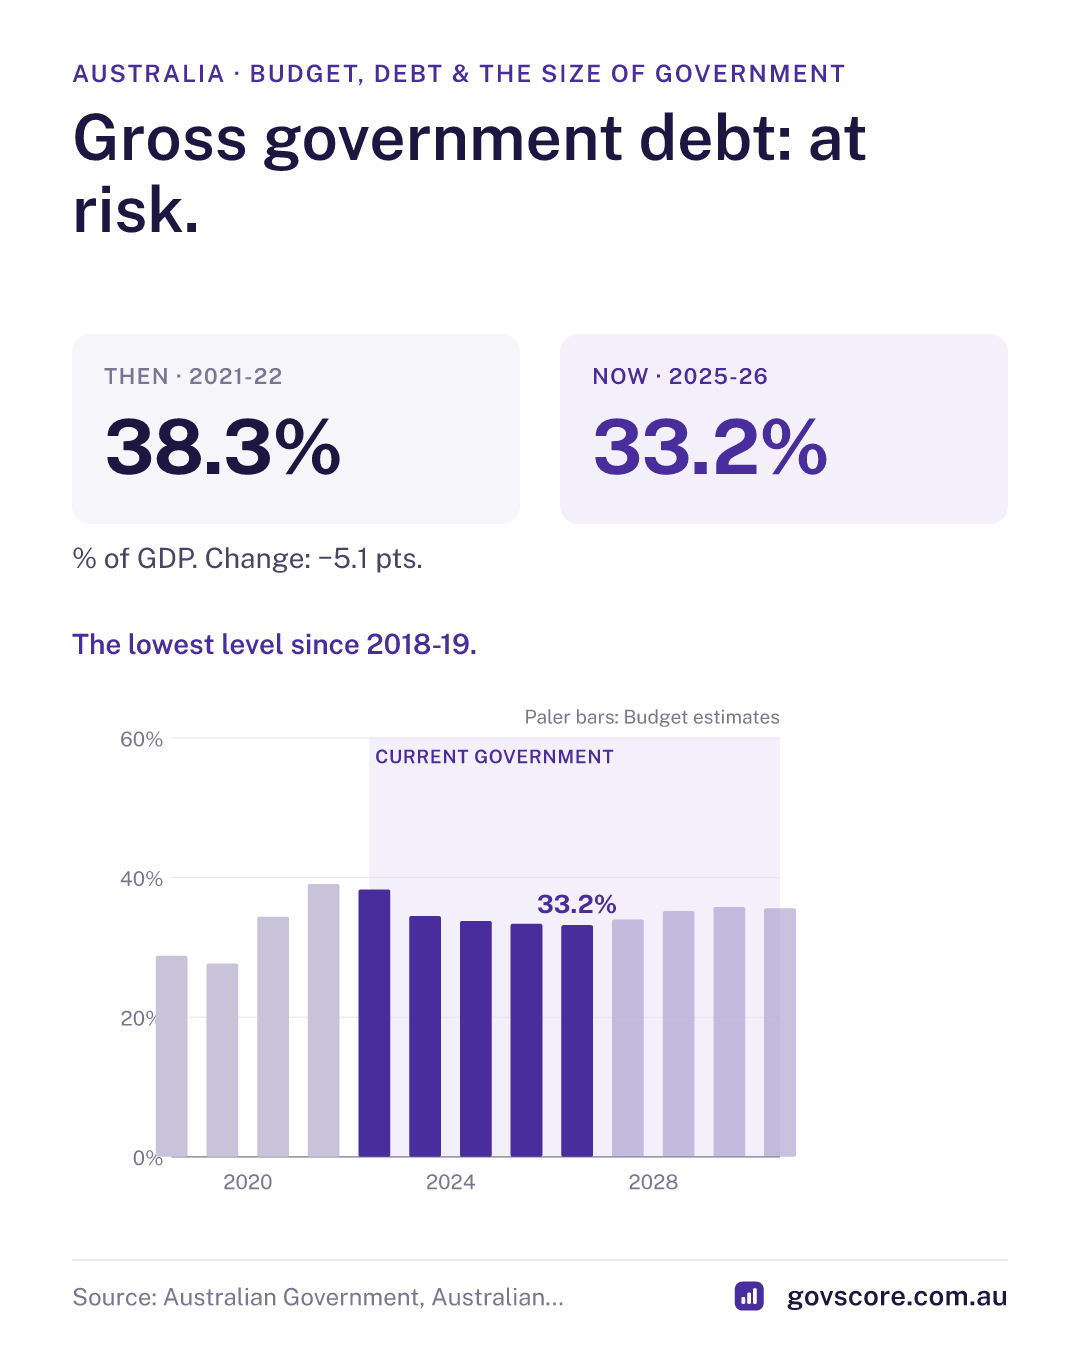
Gross government debt: at risk. The lowest level since 2018-19.
- Latest
- 33.2%
- Since the government took office
- Better−5.1 pts
- Over the past year
- little changed−0.20 pts
Gross debt as a share of GDP
- Share of GDP
The commitment
Reduce gross debt as a share of the economy over time.
How the verdict is reached
Measured the government’s own way, as a share of GDP. On track if the latest actual is lower than at 30 June 2022 and the Budget forecasts it lower still in four years; at risk if only one of those holds; off track if neither.
Today: 33.2% of GDP at the latest actual, against 38.3% in June 2022; the Budget forecasts 35.6% by 2030.
What this is
Gross debt is the face value of all bonds and Treasury notes the Commonwealth has issued and not yet repaid: the amount it must pay back to investors when they mature. It is a snapshot at 30 June each year. Net debt, a separate measure, subtracts certain financial assets the government holds.
Why it matters
Debt has to be serviced. Every dollar of interest is a dollar not spent on services or returned as tax cuts, and higher debt leaves less room to respond to the next crisis. The long view shows how debt has built up over two decades and where it is forecast to go.
More from the figures
- At 30 June 2006 gross debt was $54.1 billion (5.4% of GDP). It reached $257.4 billion in 2012-13, $542.0 billion in 2018-19 and $895.3 billion (38.3% of GDP) at 30 June 2022, when this government took office.
- It was $971.4 billion (33.2% of GDP) at 30 June 2026, the latest audited actual from the Final Budget Outcome, $10.6 billion below the Budget estimate. The Budget forecasts $1,051 billion by June 2027 and $1,249 billion by June 2030: above $1 trillion for the first time.
- As a share of the economy, gross debt peaked at 39.1% of GDP in 2020-21 and fell to 33.2% in 2025-26. The Budget forecasts it rising again to peak at 35.8% in 2028-29.
- Net debt was $550.0 billion (18.8% of GDP) at 30 June 2026, and is forecast to reach $767.8 billion by 2029-30.
How it’s calculated
Face value of Australian Government Securities (AGS) on issue at 30 June ('Total AGS on issue' column, Budget Paper No. 1 2026-27 Table 11.5), which the Budget defines as gross debt. 2005-06 to 2024-25 are actuals, identical in the 2024-25 Final Budget Outcome. 2025-26 onward are Budget estimates rounded to the nearest $1 billion. Share of GDP uses the GDP figures in the 2026-27 Budget. Actual years are cross-checked automatically every day against the AOFM register of securities on issue.