Condition
Household income per person
After tax and inflation, are households better off per person?
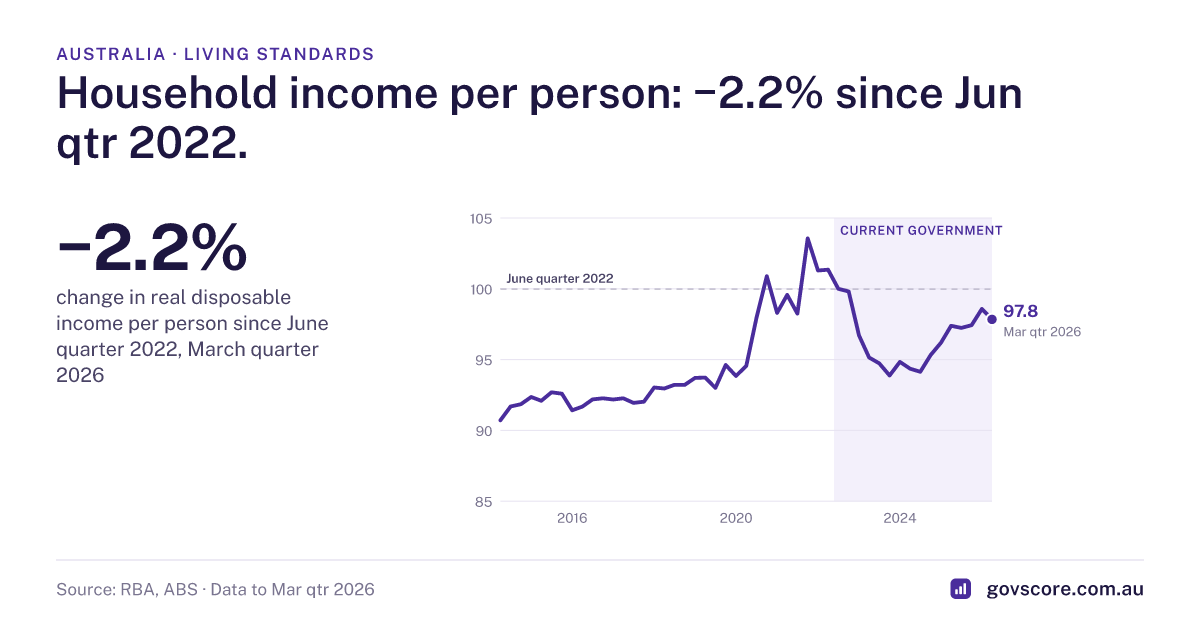
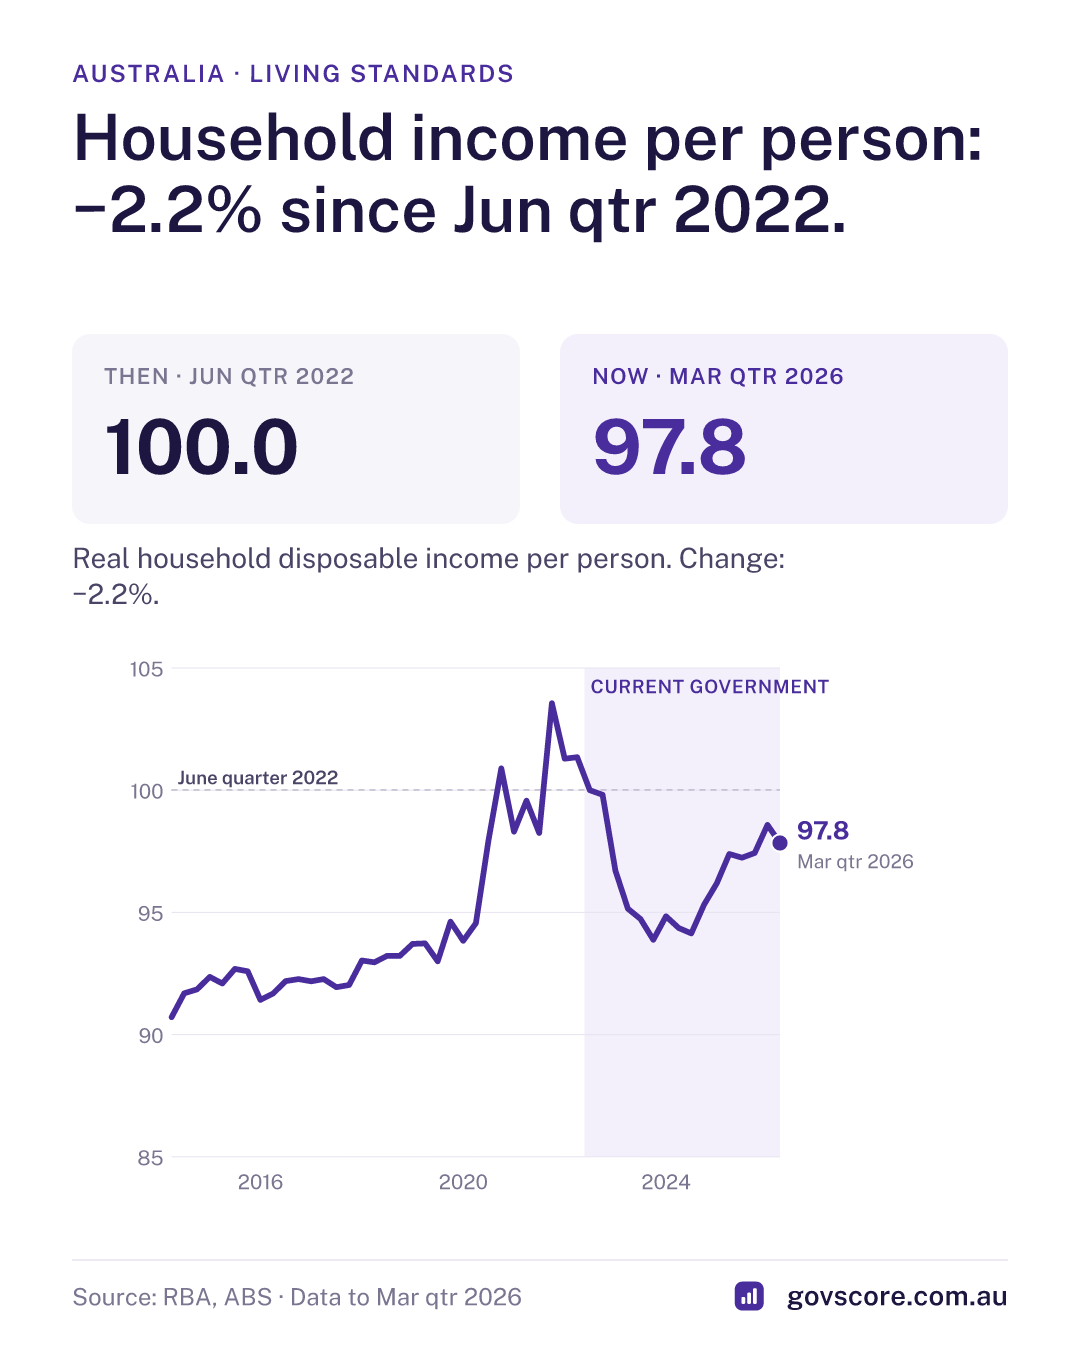
Household income per person: −2.2% since Jun qtr 2022.
- Latest
- −2.2%
- Since the government took office
- Worse−2.2%
- Over the past year
- little changed+0.5%
Real household disposable income per person (June qtr 2022 = 100)
- Seasonally adjusted
- Real, per person
What this is
Real household disposable income is the income households have left after income tax and interest payments, adjusted for inflation. We divide it by the population and set mid-2022 to 100.
Why it matters
It is one of the most complete measures of whether the average person is better or worse off, because it includes the effects of tax, interest rates and prices.
More from the figures
- That is about $61,128 a year per person after adjusting for inflation, compared with $62,479 in the June quarter 2022 (ABS chain-volume dollars).
- Disposable income is what households have left after income tax and interest payments, adjusted for inflation.
How it’s calculated
Real household disposable income ($m, chain volume, seasonally adjusted; RBA Table H2) divided by ABS estimated resident population, annualised (×4) and rebased to June quarter 2022 = 100. Limited to the latest quarter for which both series are available.