Condition
Living standards by decade
How fast are living standards growing, compared with past decades?
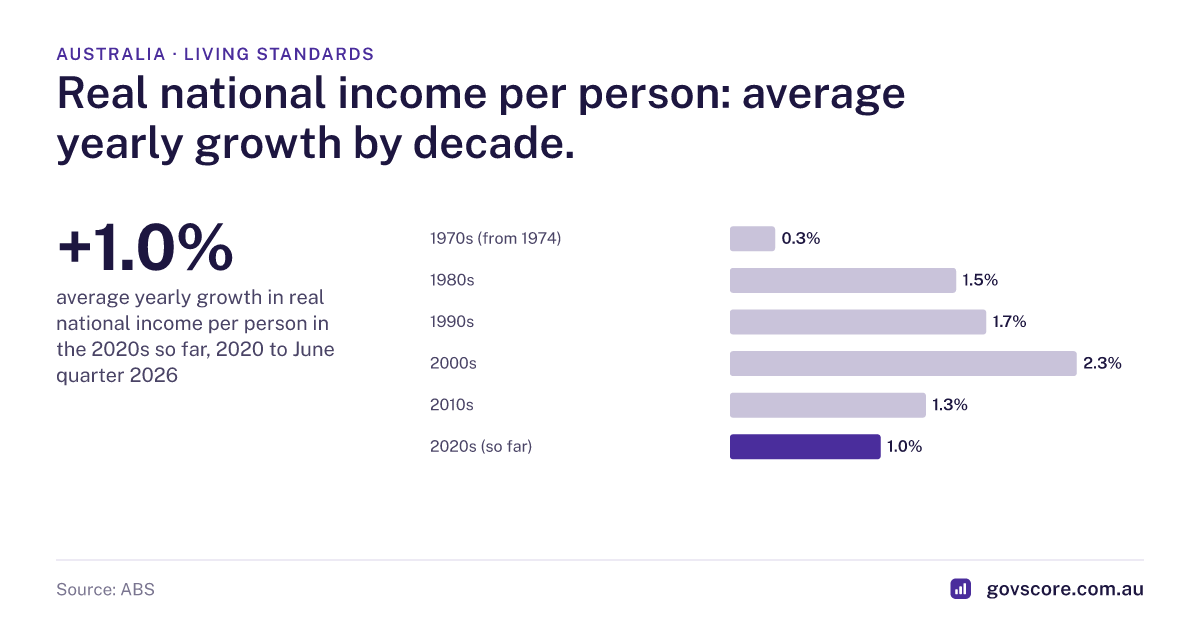
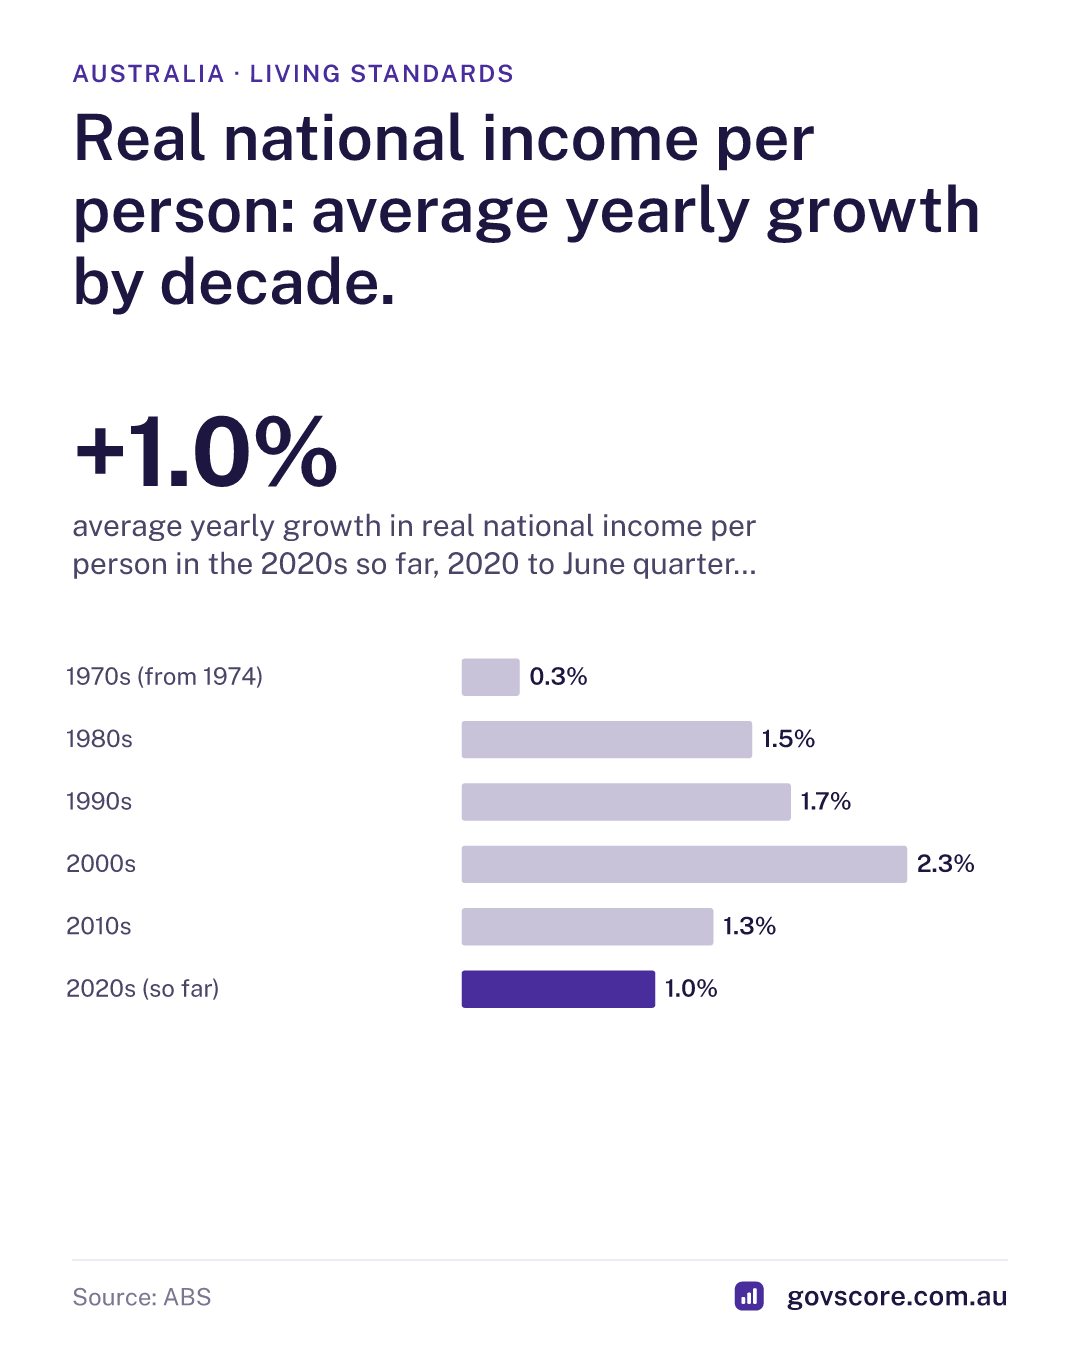
Real national income per person: average yearly growth by decade.
- Latest
- +1.0%
- Since the government took office
- Over the past year
Living standards by decade
- Average yearly growth
- 1970s (from 1974)0.3%
- 1980s1.5%
- 1990s1.7%
- 2000s2.3%
- 2010s1.3%
- 2020s (so far)1.0%
What this is
The average yearly growth in real national income per person in each decade since the 1970s. Real means after inflation; per person means it allows for population growth.
Why it matters
It puts the current period in a long view. Faster growth means each person's share of the nation's income rises faster.
More from the figures
- Average yearly growth in real net national disposable income per person, by decade: 1970s (from 1974) +0.3%; 1980s +1.5%; 1990s +1.7%; 2000s +2.3%; 2010s +1.3%; 2020s (so far) +1.0%.
- From the June quarter 2022 to the June quarter 2026 it changed −4.1% in total.
- Real net national disposable income per person is the measure the Treasury and Reserve Bank use for living standards: national income after depreciation and payments to foreign owners, adjusted for prices and population.
How it’s calculated
Year-on-year growth in ABS real net national disposable income per capita (chain volume, seasonally adjusted, quarterly), averaged over each calendar decade. The 1970s average starts in the year the series begins.