Condition
Productivity
Are we producing more for every hour worked? Productivity drives lasting wage growth.
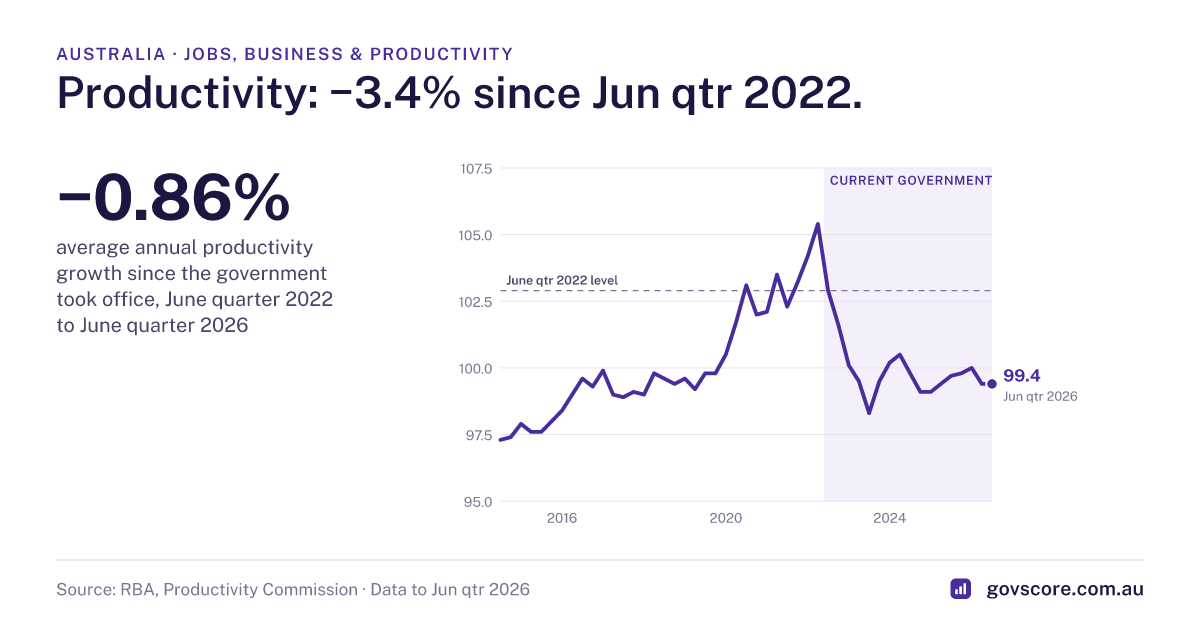
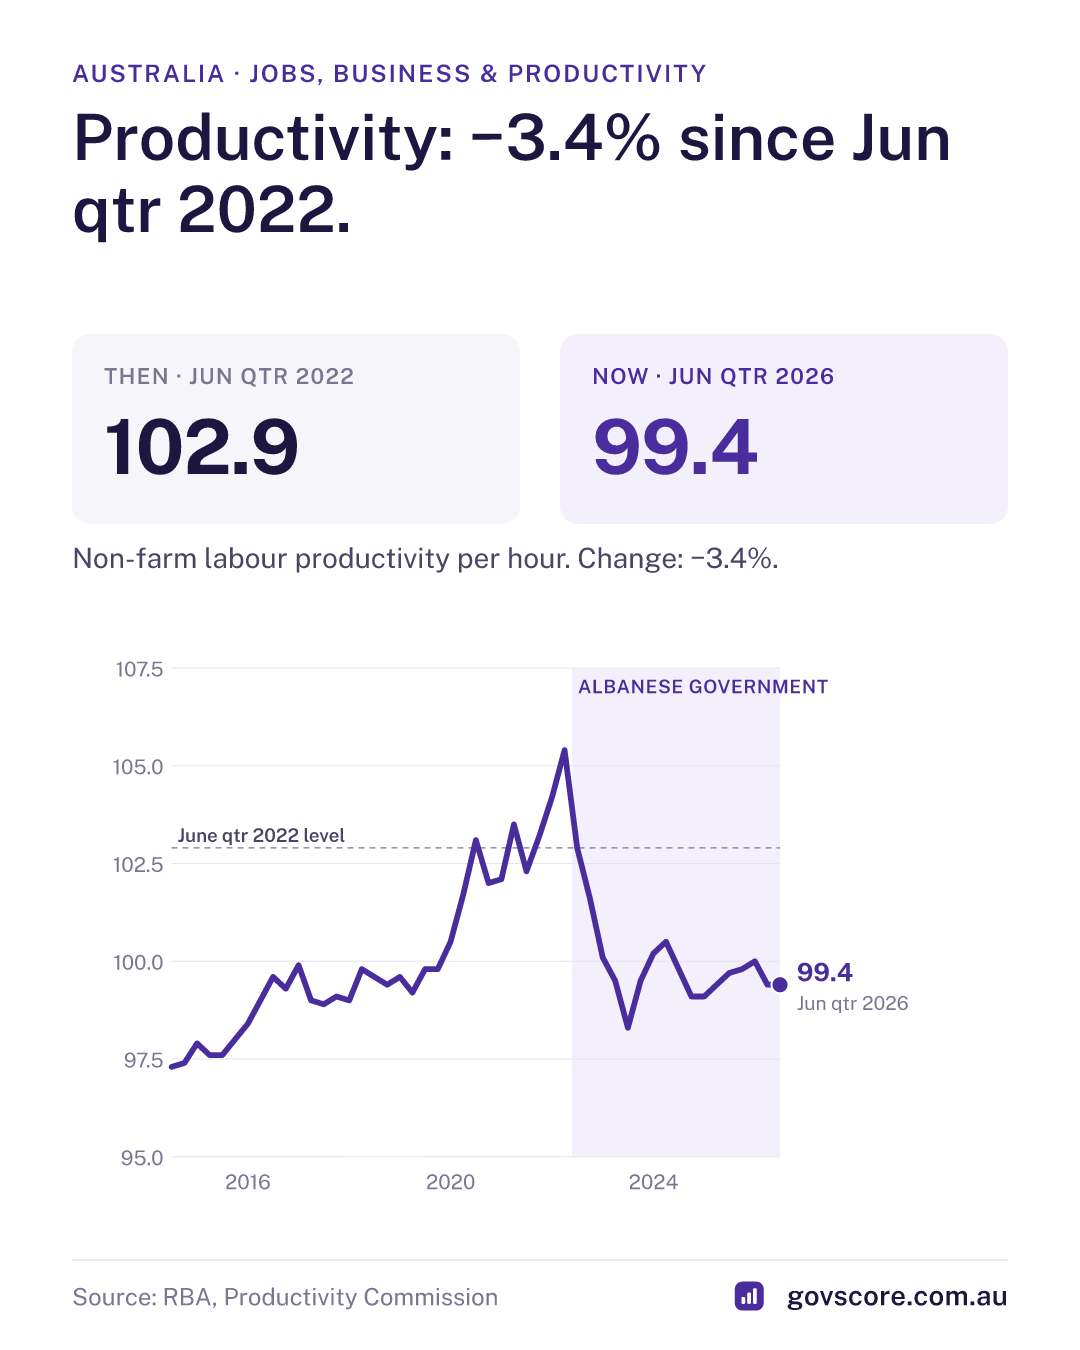
Productivity: −3.4% since Jun qtr 2022.
- Latest
- −0.86%
- Since the government took office
- Worse−3.4%
- Over the past year
- little changed−0.3%
Non-farm labour productivity per hour
- Seasonally adjusted
- Real
What this is
Labour productivity is how much the economy produces for each hour worked, measured here for the non-farm economy in the ABS national accounts. We compare average annual growth since mid-2022 with the 2000-2019 average.
Why it matters
Productivity is the only lasting way to raise wages and living standards. The Productivity Commission and RBA have both warned that weak productivity growth holds back real incomes.
More from the figures
- Output per hour worked in the non-farm economy is 3.4% below its June quarter 2022 level.
- Over the latest year productivity changed by −0.3%.
- Measured productivity was temporarily lifted during the COVID period, so the June 2022 starting point was unusually high. Against the pre-COVID December quarter 2019, productivity is 1.1% lower: an average of −0.17% a year, still below the long-run +1.17%.
- Without productivity growth, real wages cannot rise sustainably.
- Productivity Commission, June 2026: labour productivity fell 0.6% in the March quarter and grew only 0.3% over the year.
How it’s calculated
ABS national accounts non-farm GDP per hour worked (RBA Table H4). Annualised growth rates are compound averages between the quarters shown.