Condition
Government spending (share of GDP)
How big is Commonwealth spending compared with the economy, and how does that compare with the past 55 years?
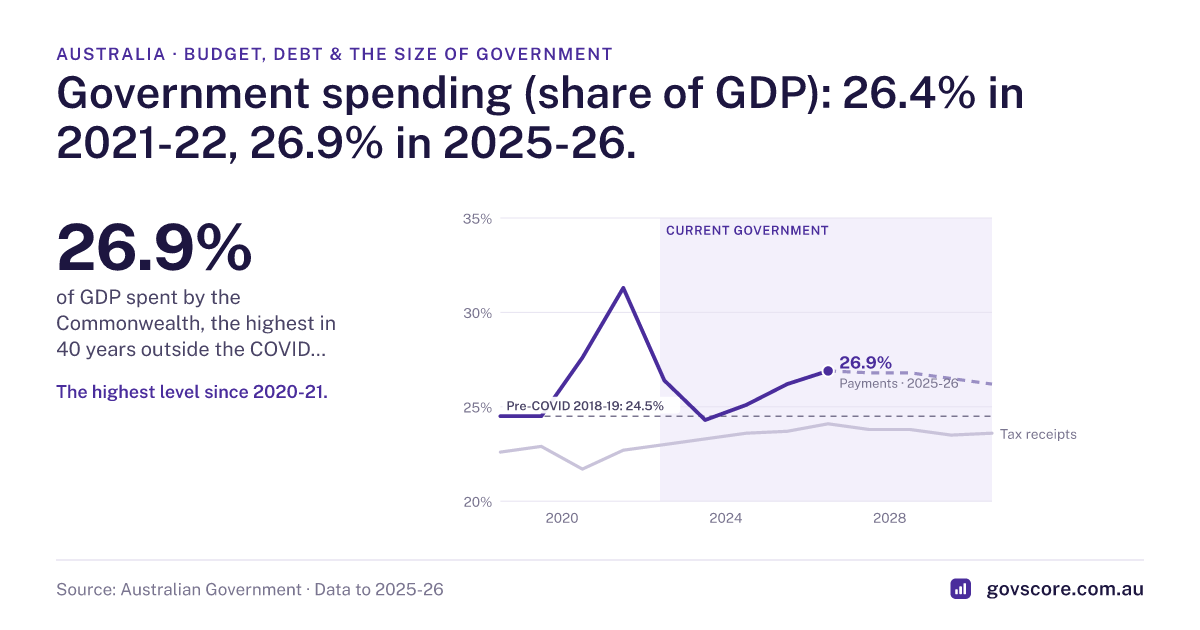
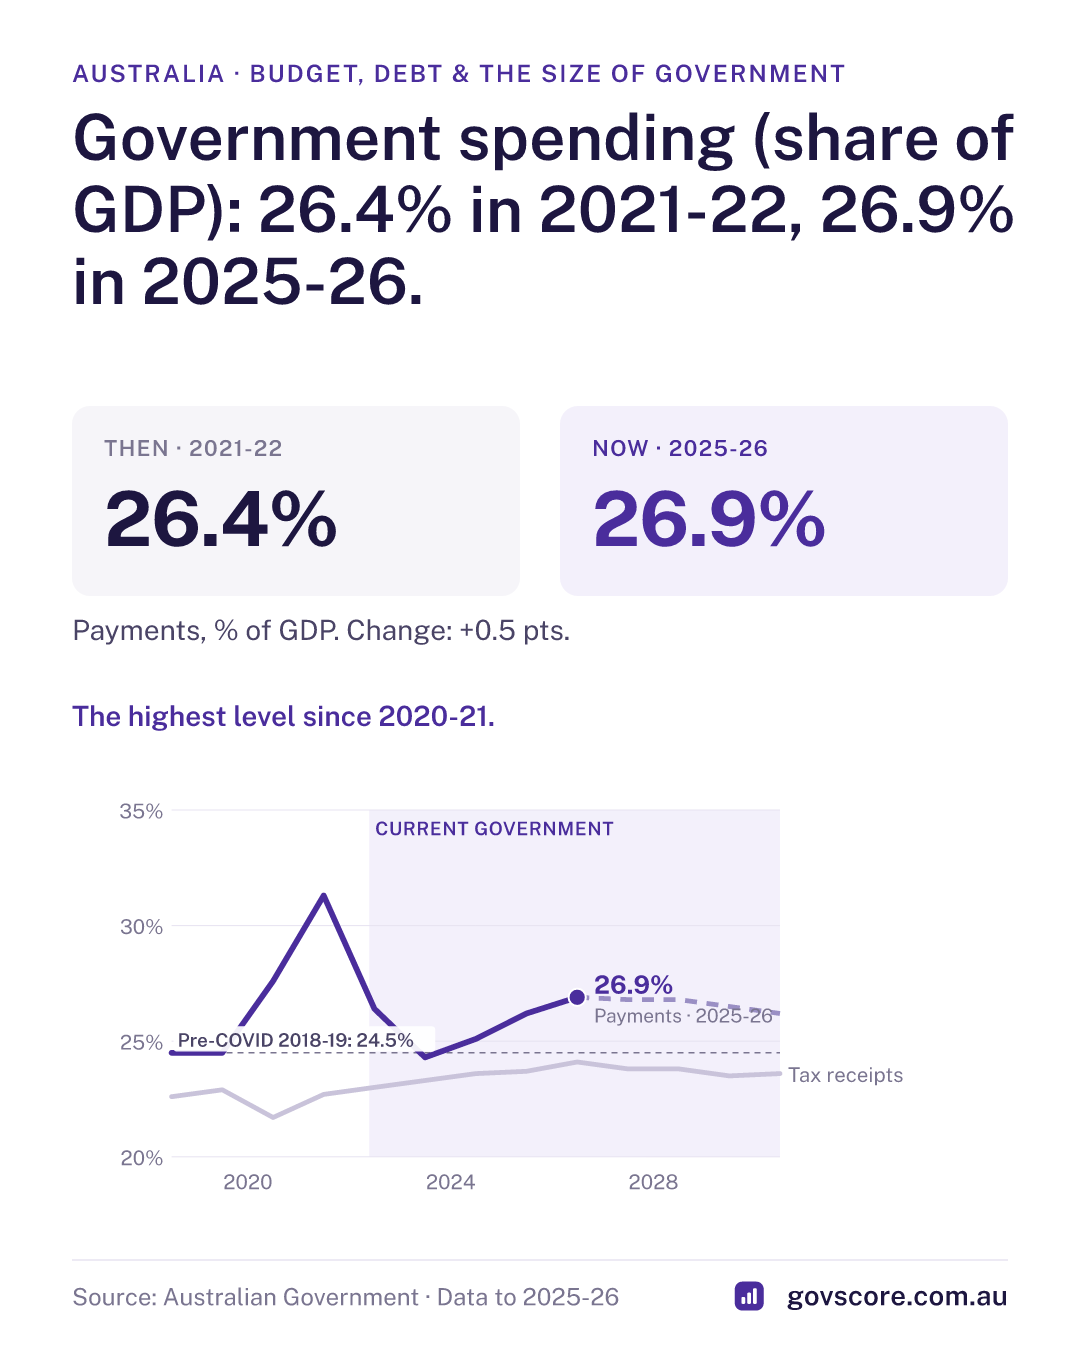
Government spending (share of GDP): 26.4% in 2021-22, 26.9% in 2025-26. The highest level since 2020-21.
- Latest (Budget estimate)
- 26.9%
- Since the government took office
- Higher+0.5 pts
- Over the past year
- Higher+0.70 pts
Government spending (share of GDP)
- Share of GDP
- Payments, % of GDP
- Tax receipts, % of GDP
What this is
Total Commonwealth cash payments (welfare, health, defence, grants to the states, interest and so on) as a share of Australia's GDP. Tax receipts are shown for comparison.
Why it matters
It shows the size of the federal government relative to the economy. When spending grows faster than the economy, it must be paid for with higher taxes, more debt, or both.
More from the figures
- Commonwealth payments were $786.6 billion in 2025-26, or 26.9% of GDP (Final Budget Outcome, released 28 September 2026). The Budget had forecast 26.6%.
- Outside the COVID years (2019-20 to 2021-22), that is the highest share since 1985-86. It is not an all-time high: spending peaked at 31.3% of GDP in 2020-21 and was 27.5% in 1984-85.
- Spending was 24.3% of GDP in 2022-23 and has risen every year since. The Budget forecasts 26.8% in 2026-27 and 2027-28, easing to 26.2% by 2029-30.
- Tax receipts were 24.1% of GDP in 2025-26. Before COVID, in 2018-19, spending was 24.5% of GDP.
How it’s calculated
General government sector cash payments and tax receipts as a percentage of GDP. 1970-71 to 2024-25 and forecasts from Budget Paper No. 1 2026-27, Statement 11 (Tables 11.1 and 11.3); 2025-26 actuals from the Final Budget Outcome 2025-26.